Minor Data Beleving

From August to the end of January I followed the minor study ‘Data Beleving’ (Data Experience) at CMD Avans in Den Bosch. This minor is all about data visualization, data strategy, data programming and storytelling. Read my blog for this minor to view my trial. I have learned to visualize data and make it interactive, but I also learned to create a story with data and tell something relevant. I have learned the open source programming language Processing which is used to make beautiful data visualizations. I have learned the javascript library ‘D3’ to create customized styling data charts and other graphs. I have been using HTML5 in the school projects ‘Sleep Apnea infographic’ and ‘Interactive Map’.
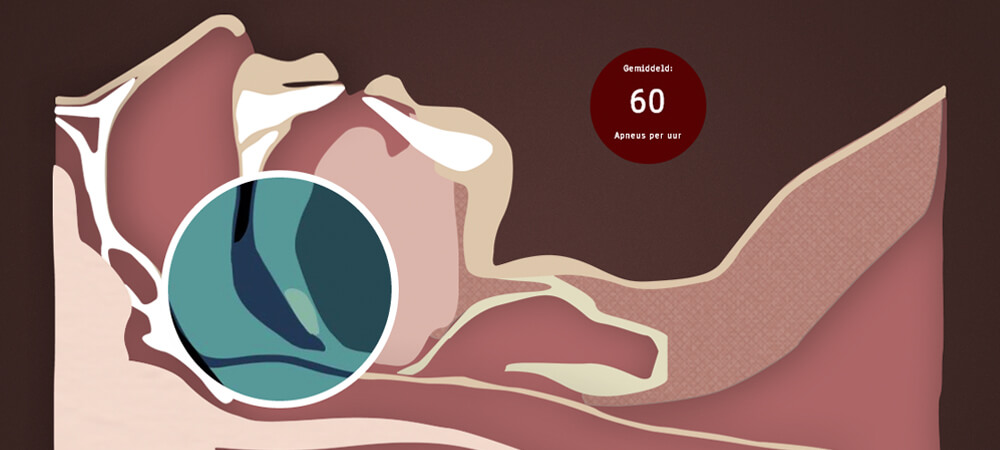
This project is about visualizing the number of Sleep Apneas before and after remove the throat tonsils. The removal of the tonsils, is one of the ENT procedures that can be dependent on the severity and depending on where the problem has arisen. The data that I have obtained was a hardcopy of statistics, numbers and charts. The thing I wanted to do was to compare the 2 datasets (before and after the treatment) with a interactive infographic for the web.
The tourist map of the Netherlands is a specific map for unique places spread all over the Netherlands. It contains 10 unique locations such as the biggest building, the most quiet place, the smallest street, the smallest house, the newest windmill, the longest bridge, the longest bench and the smallest town. With a team we went to these places for research and interviews and we gained data, information and specs about the places.
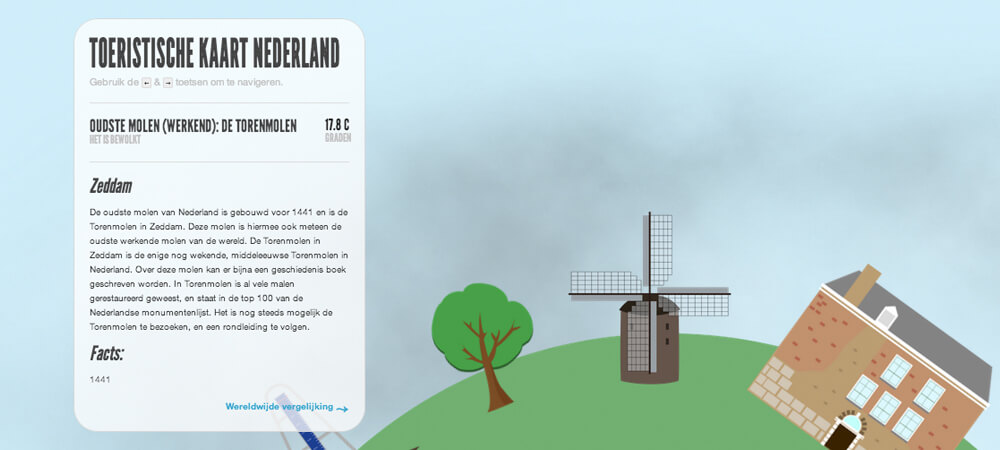
The map is a interactive globe which can be rotated. Each slice is a specific location contained with global information about the place and specifics such as total height or width. It alsof contains the information about the similar such as smallest/heighest/newest thing over the world so you can compare the location in the Netherlands with that same location in the world. It also contains the real time weather and the background changes if the weather will change. This is developed with the weather api of Yahoo. The whole interactive infographic is created with HTML5.
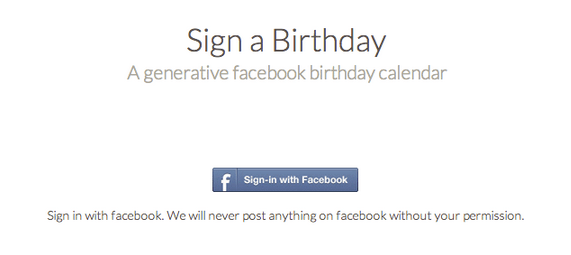
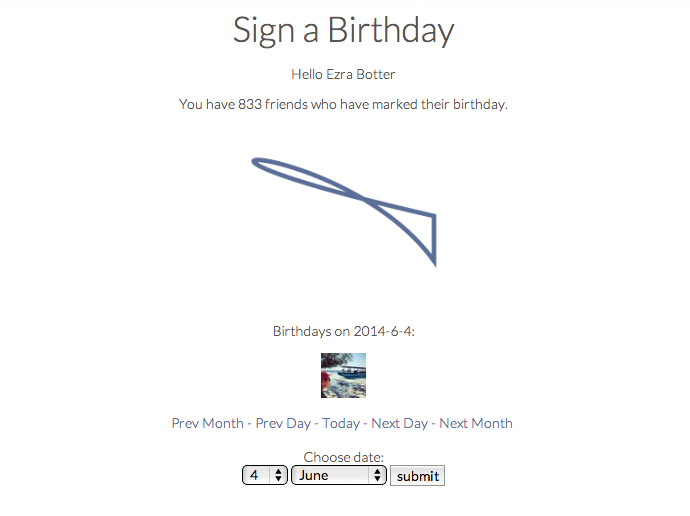
An other project was to create a generative calendar. The only requirement was that it was generative. So I have been thinking about what could be fun to make and where I could get the right data. With the Facebook API for php or javascript you can obtain information from the user such as birthdays and events. I created a facebook calendar with the birthdays of your friends. Every day of the years gets a generative logo based on the day and month, total birthdays on that day, total age, cumulative age and ratio man / woman. I created sign-like shapes so every day will get its own signature. The name of this facebook app is ‘Sign a birthday‘.
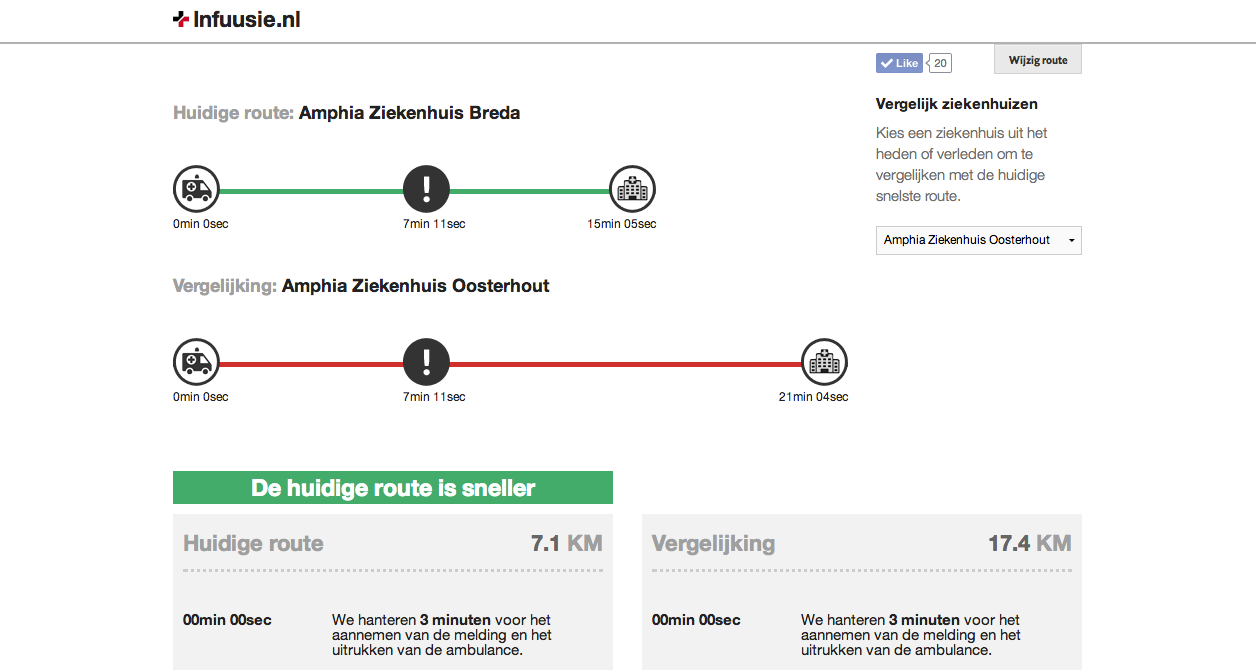
The second quarter was the main project ‘Big Data’ in co-operation with ‘Brabants Dagblad’, a newspaper for people in Noord-Brabant. We reveived a few cases. We had to research one case and visualize it for the readers of the paper so they will get more insight into the subject. The subject was the merger of a few hospitals. The Bernhoven ziekenhuis in Uden is originated from other hospitals, so is the Jeroen Bosch Ziekenhuis. Infuusie.nl compares the emergency arrival times from ambulances from the past with the present for the hospitals around Den Bosch from a current location or a completed location.
We visualized this with a web application accessible for the target group of Brabants Dagblad. You need to fill in the location of the accident. Then we calculated the route with Google maps. It shows two simple timelines to compare the arrival times from the ambulances around Den Bosch, so you will know wich route was faster, past or present. Our project is even chosen to get a highlight in an article in Brabants Dagblad.
Geef een reactie
Contact opnemen?
Neem contact met me op door te mailen naar info@ezrabotter.com of vul het contactformulier in.
Neem contact op